Enrollment Trend Analysis
How leadership identified the drivers behind a 9% year-over-year enrollment decline.
The challenge
Leadership observed a significant decline in credential-program enrollment but lacked visibility into where the decrease was concentrated.
The objective was to determine whether the decline was broad across the institution or driven by specific student segments, schools, or programs.
What leadership needed to know
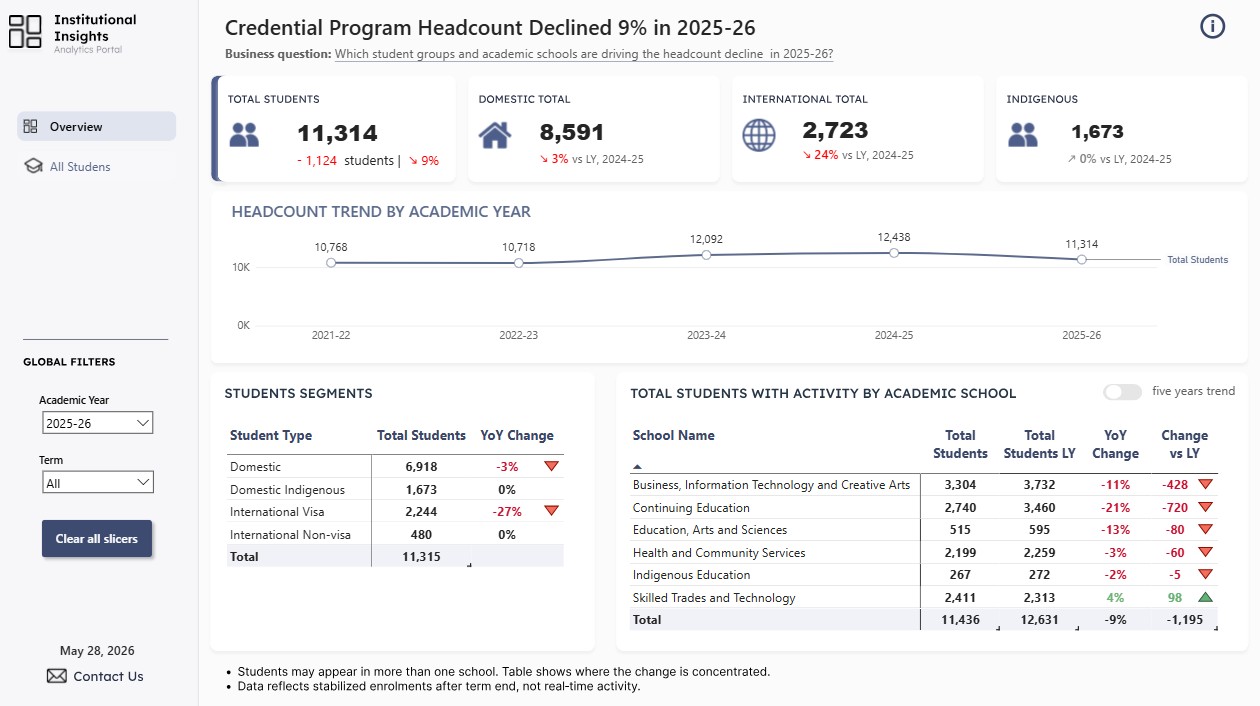
What was the overall YoY change in enrollment?
Which student segments were driving the decline?
Which academic schools were most affected?
Where should leadership focus their investigation first?
An interactive, drillable dashboard
- Executive KPI summary
- Year-over-year comparison
- Student segment analysis
- Academic school breakdown
- Program-level drilldown
- Interactive filtering and slicers
Built an interactive Power BI dashboard to deliver a clear, drillable view of enrollment movement across years, student segments, academic schools, and programs.
Dashboard flow
I translated the leadership question into a dashboard structure that moves from executive signal to diagnostic detail: first the YoY decline, then the student segments, academic schools, and program-level views needed to investigate the drivers.
Analytical flow
Business Question
Which student groups and academic schools are driving the headcount decline?
Overall Trend
Confirm the magnitude and direction of the decline over time.
Student Segments
Identify which student segments are contributing most to the change.
Academic Schools
Pinpoint where losses are concentrated so leaders can prioritize review.
Design decisions
KPI Cards on Top
Show the key metrics first so leaders understand the overall impact quickly.
Trend Line
Make the direction and magnitude of change easy to read over time.
Driver Tables
Expose the drivers of decline and show where losses are concentrated.
Clean & Scannable
Use consistent colors and directional indicators to support fast decisions.
What the data revealed
Year-over-year decline in credential-program headcount.
International Visa students were the largest student-segment driver of the decline.
Continuing Education showed the largest academic-school decline.
Why it mattered
- Identify where to investigate first and prioritize actions.
- Reduced ambiguity around whether the decline was broad or concentrated.
- Repeatable view to monitor enrollment movement across years, schools, and student segments.