Space Utilization Analysis
Analysis of classroom capacity, enrollment, attendance, and occupancy patterns to identify underused space, attendance gaps, and scheduling opportunities.
The challenge
Academic and operations teams needed a clearer way to understand how classrooms were being used across the scheduled day.
Capacity, enrollment, bookings, and attendance were not easy to compare side by side, making it difficult to separate space issues from attendance behavior.
What the teams needed to know
Which rooms and time slots are underutilized?
When does occupancy peak during the day?
How large is the gap between enrolled and attending students?
Is low utilization driven by capacity, scheduling, or attendance behavior?
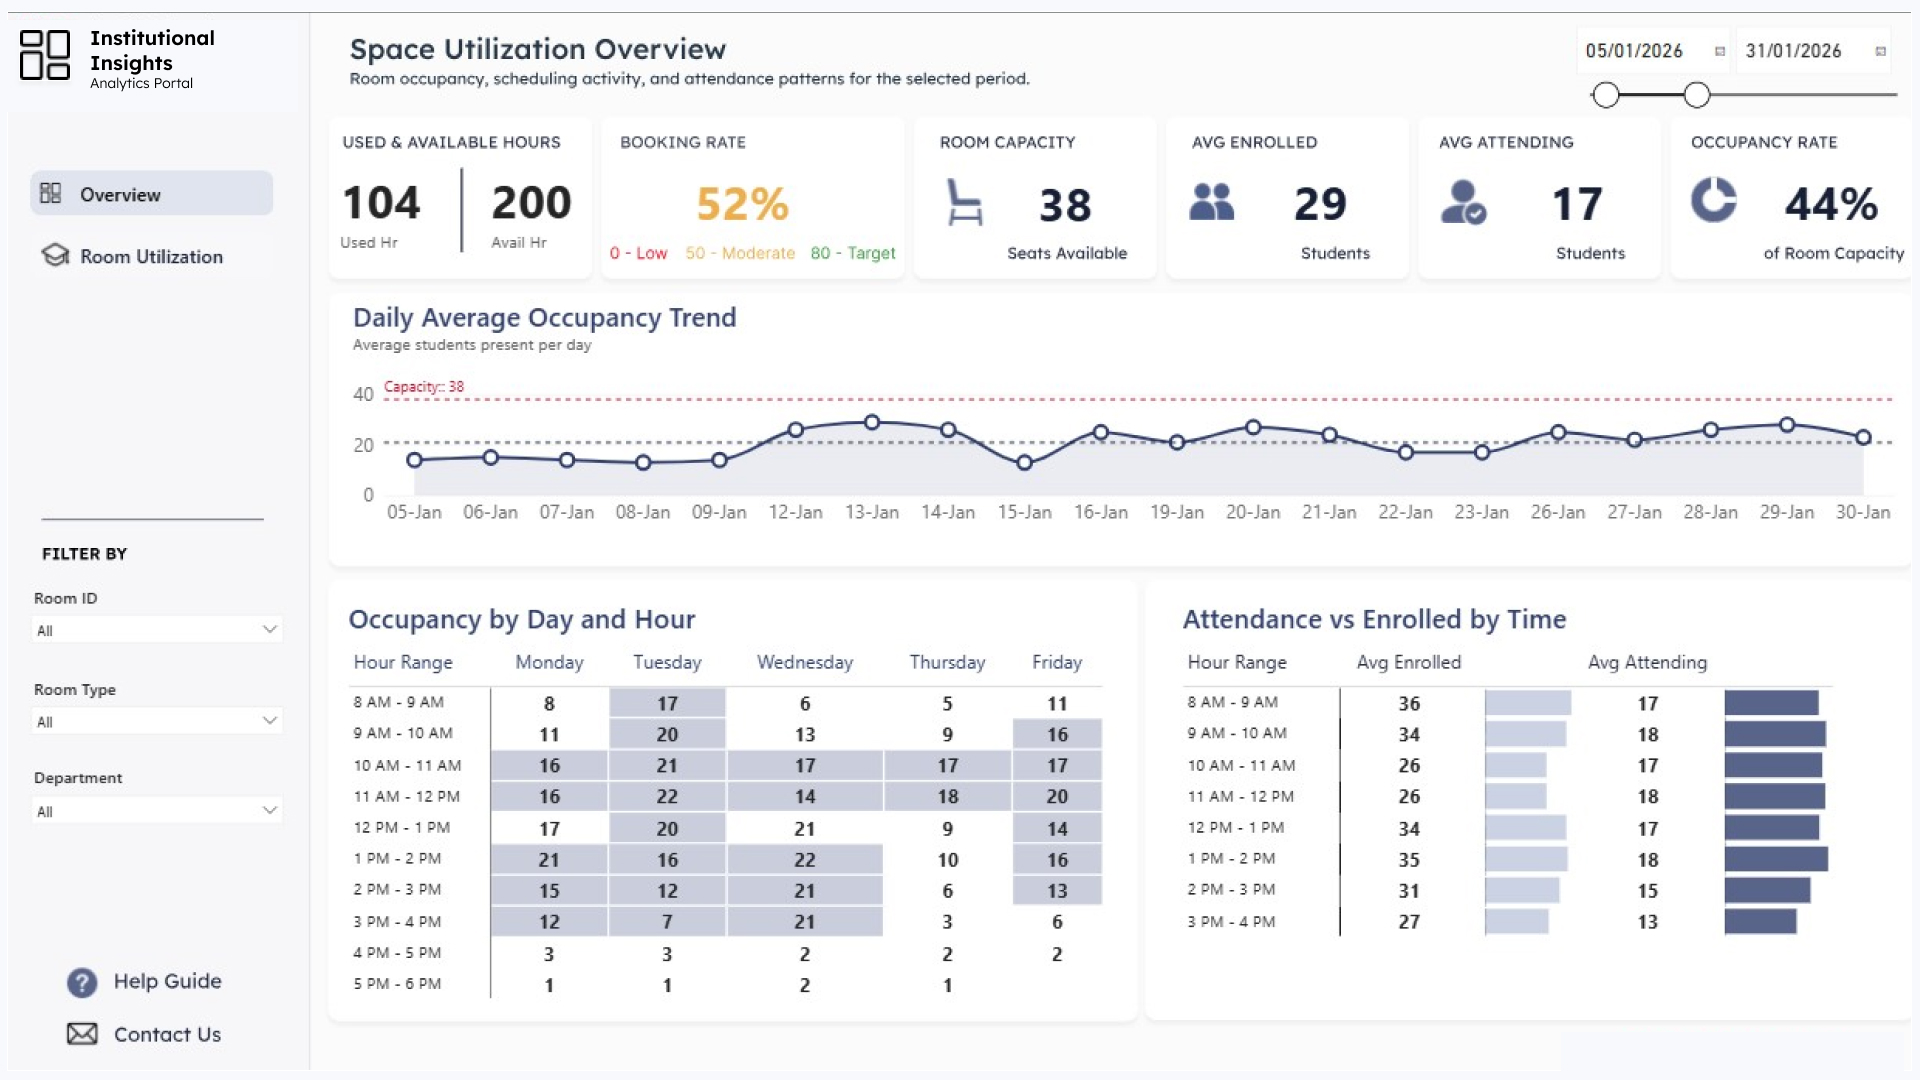
Planned demand vs. actual usage
- Executive KPI cards — used hours, booking rate, capacity, enrollment, attendance, occupancy rate
- Daily average occupancy trend compared against room capacity
- Occupancy heatmap by weekday and hour range
- Attendance versus enrollment comparison by time of day
- Room, room type, and department filters
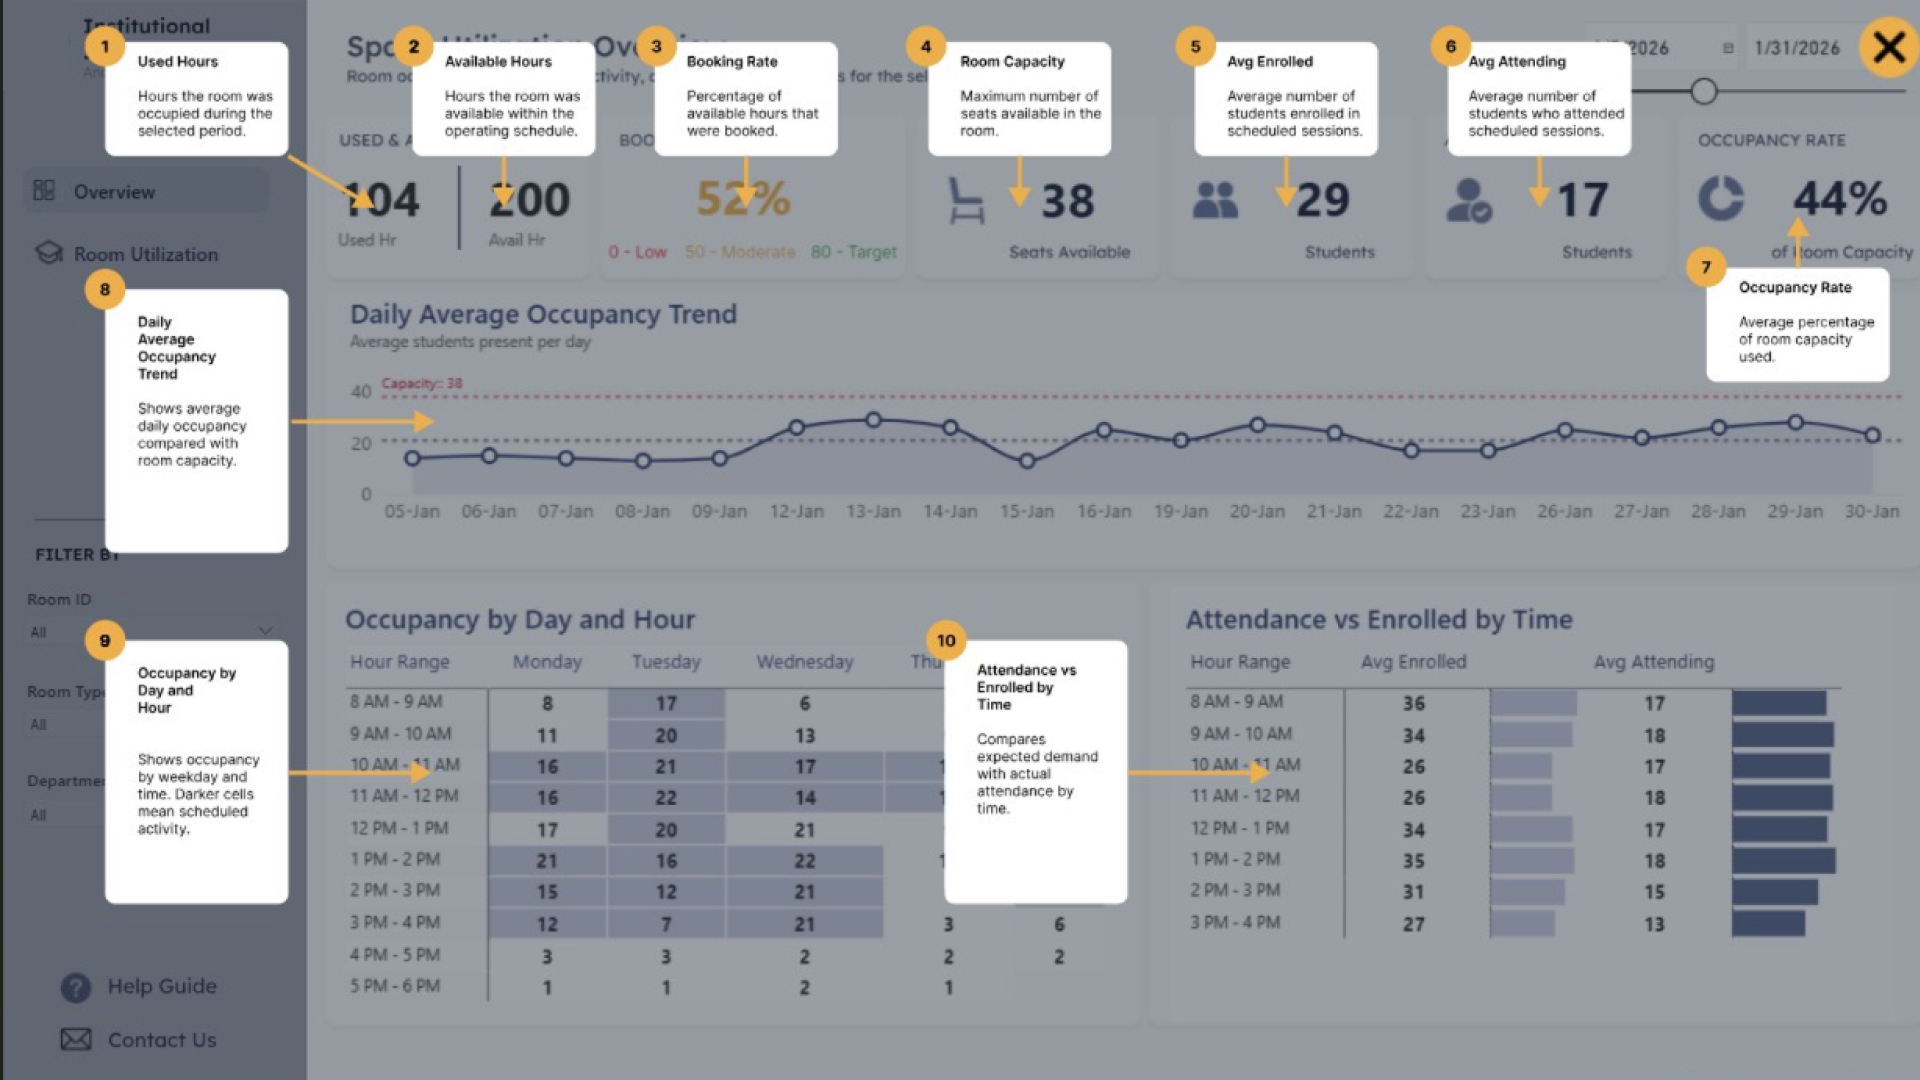
- Guided tutorial overlay explaining the dashboard metrics
I combined room capacity, enrollment, booking, and attendance data to compare planned demand against actual usage and reveal underused periods.
Guided dashboard experience
One of the requirements was to make the report easier for new users to understand without separate training.
I added a built-in Help Guide that explains each KPI, chart, and metric in context. The dashboard pairs the final analytical view with a guided overlay designed to support user adoption.
What the data revealed
Booking rate showed moderate use of available operating hours.
Occupancy rate indicated that less than half of available room capacity was being used.
Enrolled versus attending highlighted a consistent attendance gap across scheduled sessions.
Why it mattered
- Improved visibility into when classroom space was being used and where utilization was low.
- Separated capacity from attendance so teams could avoid treating every utilization issue as a space shortage.
- Supported scheduling decisions with a repeatable view of room, day, and hour-level utilization.