Case 01 · ENROLLMENT ANALYTICS
Investigating Enrollment Decline
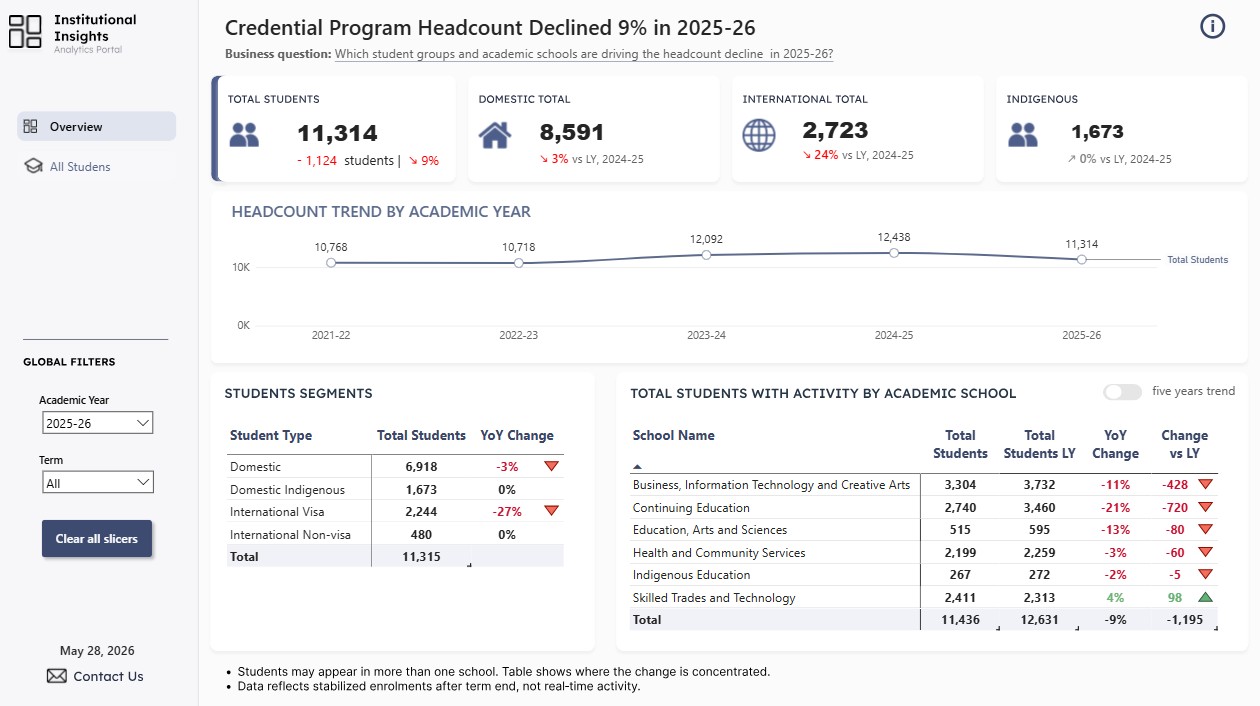
A 9% enrollment decline was isolated through student population analysis, identifying the schools and student segments driving the change.
- Question
- Where is the enrollment decline concentrated?
- Signal
- International Visa and Continuing Education drove the largest losses.
- Outcome
- Leadership could focus investigation on the affected groups first.